UX Research
Case Study: Yara FarmCare App's
Map-my-farm feature
Conducted research on the FarmCare App's Map-my-Farm feature that allows farmers to measure their farm and plan crop rotations. Identified challenges faced by users and suggested improvements.
DURATION:
1 month
SKILLS:
User Interviews, Usability Testing, Remote Testing, Competitor Analysis, Stakeholder and Relationship Mapping
MY ROLE:
-
Led the end-to-end UX research process
-
Drafted and executed a detailed research plan
-
Conducted and moderated user interviews and usability tests
-
Synthesized findings and collaborated on design recommendations


Yara FarmCare is a mobile app enabling farmers to purchase fertilizers and agri-products, and access digital tools to improve their productivity. As Yara expanded its agri-tech services, it launched the Map My Farm feature, designed to help farmers digitally map their fields for planning and resource management. Despite its potential, the feature saw low adoption, with an 81% drop-off rate in the mapping flow. My team was tasked with uncovering the reasons behind this and recommending improvements, especially as the feature was being prepared for launch in new markets.
-
The study resulted in a redesigned “Map My Farm” feature that is more accessible, multilingual, and user-friendly, enabling farmers to easily map their fields, understand instructions, and complete the process even with limited connectivity or digital literacy
-
This led to a 57% increase in feature usage, a 38% improvement in usability scores, and a rise in user satisfaction, while also surfacing broader insights that shaped Yara FarmCare’s product strategy for future improvements
Research Objectives
From a previous study, researchers had concluded that we could reduce the current drop off rate of 81% if the user is able to measure their farm land and get an accurate measurement value.
In order to identify what was contributing to the drop-off and to remedy it, we were tasked with investigating through a series of Usability tests with farmers.
01
Identify barriers to adoption and usage of the Map My Farm feature
02
Understand the needs, behaviors, and pain points of farmers across diverse Indian states
03
Inform a redesign that would increase feature adoption and satisfaction, especially in new markets
Research question
"HOW COMFORTABLE ARE FARMERS WITH PERFORMING AND UNDERSTANDING MANUAL MEASUREMENTS WITH THE MAP MY PLOT FEATURE OF THE FARMCARE APPLICATION?"
Asking whether farmers are comfortable doing manual measurement is a way to
understand how well the prototype:
-
Guides the user through the activities required-to map a plot and communicates the intended workflow in a comprehensive and clear manner
-
Supports users’ ability to find out the size of ttheir plot
-
Shows how users think and provides context for design decisions
With regard to google earth, the session will help understand:
-
The users' familiarity with a satellite map (reading and understanding data)
-
The users' familiarity with a with the google earth gesture control
Each of these points were fruther broken down into specific questions to be answered during the research. There were two categories of questions:
1. Behaioural and Attitude. For example;
B: "Does the user know how to move from one step of the activity to the nest?"
A: "How does the interface and the application make the user feel? (intimidated, taken lightly, uneducated, inadequet, confident etc.)"
2. Qualitative and Quantitative
Qual: "Were there instances where the users felt unsure of the next step? What confused them?"
Quant: "Time taken by users to complete each task and why."
Research Approach

Competitor Analysis
Benchmarked similar agri-tech mapping tools to identify best practices and gaps.
Iterative Testing
Conducted rounds of prototype testing to validate improvements and uncover persistent issues.
Foundational & Exploratory Research
-
Telephone Interviews: Conducted in-depth interviews with farmers in various Indian states to understand their workflows, digital literacy, and attitudes toward technology.
-
Surveys: Surveys were used to collect general information regarding use and behaviours
-
Remote Usability Testing: Enrolled farmers in multiple rounds of remote usability testing, observing their interactions with the Map My Farm feature.
Data Analysis
Used affinity mapping and thematic analysis to synthesize qualitative and quantitative data.
Usability Testing Methodology
We conducted a task-based usability study using the Map My Plot Figma prototype and Google Earth Mapping Tool, where participants completed two core tasks in their own context, followed by a debriefing interview.
We collected both quantitative data (error and success rates) and rich qualitative insights through semi-structured, interactive sessions with a moderator, focusing on participants’ attitudes, behaviors, and overall experience with the interface to inform further design iterations.
Before the sessions, we developed a semi-structured script in two languages (english and hindi with screenshots to ensure consistency across sessions. We also highlighted what the moderator should pay attention to at each stage. This was followed with a pilot test to refine the interview and task flow.

Location
A remote , moderated setting was used for the study. The farmers’ were in their natural environment. We communicated with users via remote means.
Tools and Use
-
Communication with users
- Telephone
- WhatsApp -
Remote usability testing
- Participate App
- Lookback App
- Whatsapp -
Stimulii
- Figma Prototype
- Google earth
Participants
There were a total of 15 participants distributed across 5 states in India with the highest use of the FarmCare app.
We had an assortment of participants who:
1. Were returning users of Map-My-plot (5)
2. Who dropped off during the activity (5)
3. Who have never used it before (5)
Session flow

Research challenges
Recruitment + Participation
There was a difficulty in recruiting and retaining users for remote testing in this demographic.
Users Contacted: 149
Users Answered: 68
Agreed To Participate: 32
Sucessfully completed the test: 1
Internet & Data Constraints
-
Most users relied on limited daily mobile data, making them hesitant to download large apps or participate in lengthy sessions.
-
Unreliable internet connectivity led to patchy communication and frequent session interruptions
Data Privacy Concerns
Participants were apprehensive about downloading unfamiliar apps, fearing for their data privacy and security. Some refused to provide their email addresses or personal information.
Device & Onboarding Barriers
-
Many users could not use the internet and phone simultaneously, as their devices did not support both at once. This often required users to have a second device for communication and testing-a significant barrier.
-
Onboarding through Lookback.io was challenging, as the platform’s instructions and permissions were only in English, creating confusion and delays.
-
The app download and onboarding process alone could take 40 minutes, making the total session time (including testing) up to 80 minutes-too long for most users.

Key Insights
Instructional & Technical Barriers:
01
Language & Communication
-
The language of instruction on Lookback.io and within the app was English, while many users were not fluent, leading to misunderstandings about permissions and steps.
-
Regional dialects sometimes made verbal communication challenging for moderators.
Adaptations
-
To overcome onboarding barriers, we sent step-by-step screenshots via WhatsApp, allowing users to follow along at their own pace.
-
Moderators provided real-time support and translated instructions as needed.
1. The mapping workflow was not intuitive and farmers often did not know what to do next.
2. Coachmarks (in-app guides) were often overlooked or misunderstood.
3. Many farmers struggled with unclear instructions and technical jargon.


^ (left) (middle) Google Earth mapping, (right) FarmCare
Unmet Needs:
1. Farmers desired step-by-step guides in local languages. They felt the provided information was not enough for them to complete the task at hand.
02


^ FarmCare App. Shown when we first
enter the map-my-farm feature
2. Offline mapping capability
Currently, internet is constantly required which makes it difficult for farmers since most of them have limited internet plans.
3. Easier ways to edit or correct mapped fields.


^ (left) FarmCare (right) Google Earth mapping
Task-Specific Pain Points:
1. Users hesitated at the start, unsure where to click to begin mapping.
03

^ (left) FarmCare App. (middle)(left) Google Earth
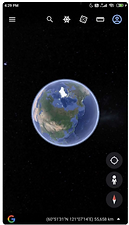
3. Users often could not correlate satellite maps to their real-world fields, especially when landmarks were missing.
2. Many could not distinguish between icons or interpret the meaning of numbers displayed (e.g., area in square meters).


^ (left) FarmCare App. (middle)(left) Google Earth
4. When information was inaccurate, users did not know how to correct it.

Digital Literacy
1. Varying digital familiarity made navigation and feature discovery difficult. Some farmers were unfamiliar with satellite imagery and map gestures, leading to hesitation and errors.
04
Infrastructural Challenges
1. Poor internet connectivity
2. Low-end device usage led to slow load times and app crashes.
05
Suggested Design Solutions
Simplified Onboarding
Introducing a multi-language onboarding video for the Map My Field feature with real life and app interactions with actionable steps.
Each of these steps should also be listed with screenshots in the help section of the feature to be revisited while performing a mapping.
01
Offline Support
Enabling offline mapping and data sync to accommodate connectivity issues.
So regardless of internet status, the farmer will be able to map their farm,
02
UI Enhancements
Redesigned buttons to make it clear which ones can be pressed or not.
Adding clear navigation cues for with improved, unambiguous iconography.
04
Localized Content
Translate all instructions and labels into regional languages, using simple, farmer-friendly terms.
03
Accessibility
Improved color contrast and larger touch targets for better usability on low-end devices.
05
Impact and Results
-
System Usability Scale (SUS) scores: improved by 38% post-redesign.Usability Scores:
-
Adoption: Feature usage increased by 57% in pilot regions within three months of relaunch.
-
Task Completion: The feature's drop-off rate fell from 81% to 36%
-
User Satisfaction: Follow-up interviews and surveys showed an increase in satisfaction with the app’s ease of use and usefulness.
-
Business Outcomes: The research uncovered additional pain points in unrelated features, informing the product roadmap for future quarters. The FarmCare app was subsequently introduced in new markets and the findings from this study ensured the app could be redesigned for launch.
-
Understanding our Users: Although the research targeted the Map-my-farm feature, the findings of the study were widely applied to the design and evaluation of other features of the app. This study provided insight into our user's comfort with the tools we design for them and what we could improve. It also revealed other issues faced by the users such as issues with getting help from customer service that were passed on for imporvement of the overall service.
Reflection
This project highlighted the critical importance of contextual, user-centered research in agri-tech, especially when expanding into diverse and emerging markets. The challenges we faced-ranging from recruitment and technical constraints to language and privacy concerns- forced us to adapt our methods, communicate creatively, and remain empathetic to users’ realities. These adaptations not only improved our research outcomes but also informed our design solutions, ensuring they were grounded in the real-world context of our users.
Conclusion
Through a rigorous, iterative research process-grounded in real-world usability testing, observation, and creative problem-solving- we transformed the Map My Farm feature from an underutilized tool into a farmer-friendly solution. This directly contributed to increased adoption, satisfaction, and business growth for Yara FarmCare, and seeded ongoing improvements across the app.
This case study demonstrates my ability to lead comprehensive UX research in complex, real-world contexts, delivering actionable insights and measurable impact for both users and the business-even in the face of significant logistical and cultural challenges.